
Nimble Intelligent Solutions
Professional Services Firm
“Nimble Intelligent Solutions is specialize in Business Intelligence & Analytics. We are the constantly emerging as one of the best BI consulting firm with our client centric approach. Since our invasion in the industry we have served number of global clients with outstanding performance. We believe in making the enterprises self-capable to accelerate the decision-making process with unrivalled BI solutions. We blend the technology and skill to drive the best outcomes from your data.”
Browse MoreServices We Provide

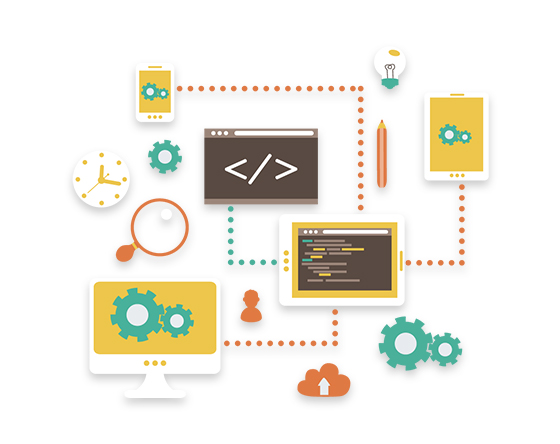
Nimble-i craft an effective path for successfully integrating & implementing the BI solution.

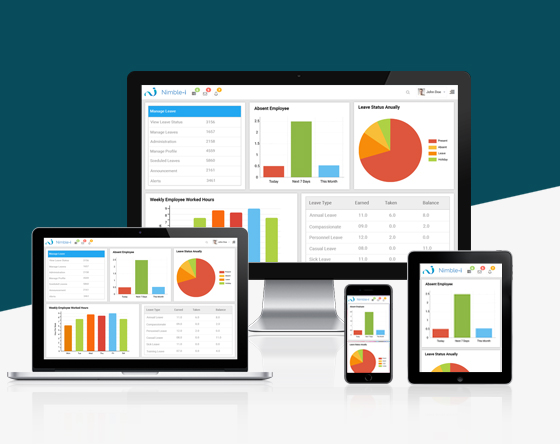
Access your data in the visually rich and pictorial format using the Modern Dashboard.

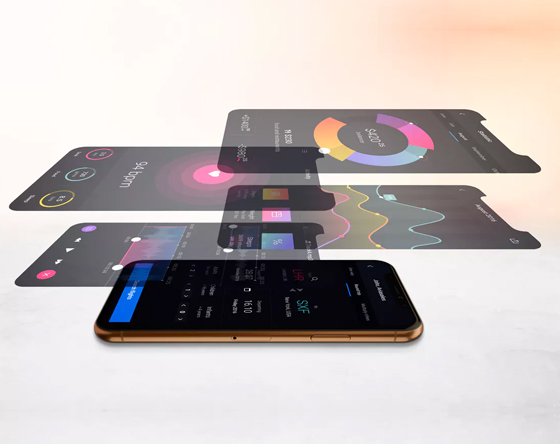
Understanding the need of entrepreneurs & corporate professionals, we provide Mobile BI Applications.

Nimble-i experts offers SDK customization for adding more functionalities and features to the MicroStrategy & other BI solutions.


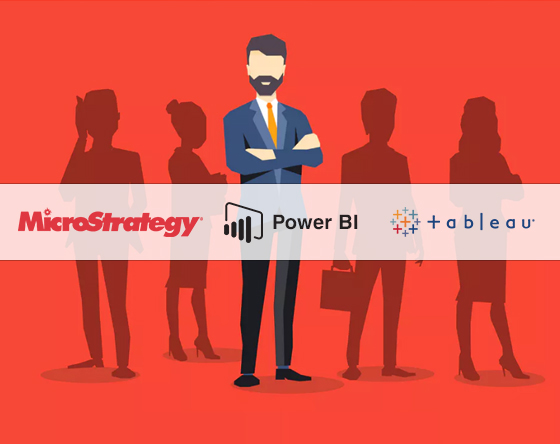
Nimble-i offers the staffing service for organizations seeking the right candidates for their vacant places.


Data Insight
Industries We Serve

Healthcare

Financial Services


Manufacturing

Market Research

Media & Entertainment

Travel and Hospitality
Travel and Hospitality
Nimble-i has the expertise and experience in implementing the BI so...
Read moreRequest A Call Back
Contact Us